The "Averaging Down" Math: Why Your Brain Can't Do It Alone
We’ve all been there. You bought a stock at ₹500 because the "vibes" were right, and now it’s sitting at ₹420. You want to buy more to bring that average cost down, but let's be honest doing that math in your head while watching the red candles on the screen is a recipe for a headache.
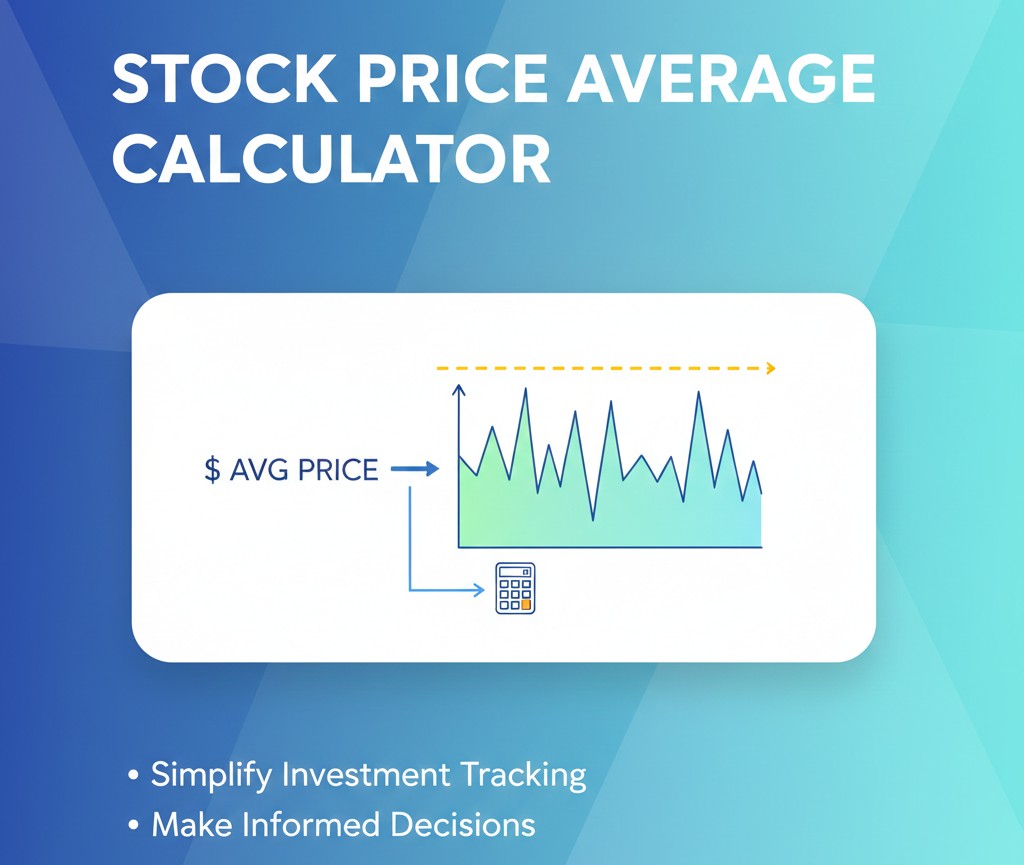
A stock average price calculator is basically your "chill pill" in a volatile market. It stops you from guessing and shows you the cold, hard numbers of where your break-even point actually lies. It's the difference between "I think I'm safe" and actually knowing your exit strategy.
Practical Tips for the Average Investor
- Don't just chase the bottom: People call it "Catching a falling knife." Only use an average calculator if you actually believe the company is solid. Averaging down on a sinking ship just means you lose more money, faster.
- Remember the charges: Most calculators don't include brokerage or STT. If you’re buying in small chunks, those fees add up and shift your true average price slightly higher than the tool shows.
- Psychological Trap: Just because your average dropped from ₹500 to ₹460 doesn't mean you're "winning." You're still down until the market price crosses that line!
A Quick Real-Life Example
Last year, I grabbed 100 shares of a tech firm at ₹1000. It tanked to ₹800. I panicked and thought if I bought another 100, my average would be ₹900. Simple, right? But what if I only had enough cash for 50 shares? The math gets messy fast. Using a calculator showed me my new average would be ₹933. That 33 rupees matters when you're looking for an exit window during a small bounce.
The Big Misconception
Many beginners think "averaging down" is a magic trick to fix a bad investment. It's not. It’s a capital management tool. If you keep pouring money into a bad stock just to see the "Average Price" number look prettier, you're essentially gambling. Use the calculator to plan your Total Outlay so you don't over-leverage yourself on a single bet.
Questions People Actually Ask
It’s basically the Total Money Spent divided by the Total Number of Shares. Formula-wise: ((Price 1 * Qty 1) + (Price 2 * Qty 2)) / (Qty 1 + Qty 2). It’s simple, but a calculator handles the weird decimals for you.
Honestly? It's risky. In intraday, you're fighting the clock. Averaging down can lead to huge losses if the trend doesn't reverse before 3:30 PM. I'd say keep it for long-term holdings mostly.
If you have multiple entries (like buying 5-6 times), an Excel sheet is better because you can save it. For a quick "Should I buy this dip?" decision, a web-based tool is much faster.
That's when you buy more of a winning stock as it goes up. It increases your average cost but also increases your position size in a stock that is clearly performing well. It's a sign of confidence.
Yes! Instead of share price, just use the NAV (Net Asset Value) and the number of units. It works exactly the same way to find your average cost per unit.